The wildfire safety map customers open before the winds come up
- React
- D3.js
- ESRI Maps SDK
- Tailwind CSS
- Figma
An interactive recreation of the public map — fictional counties, illustrative project data, real UI behavior. Search by address or county, switch the category, open a county to see what's planned. The live production site is linked above.
React + D3 over an ESRI Maps SDK base
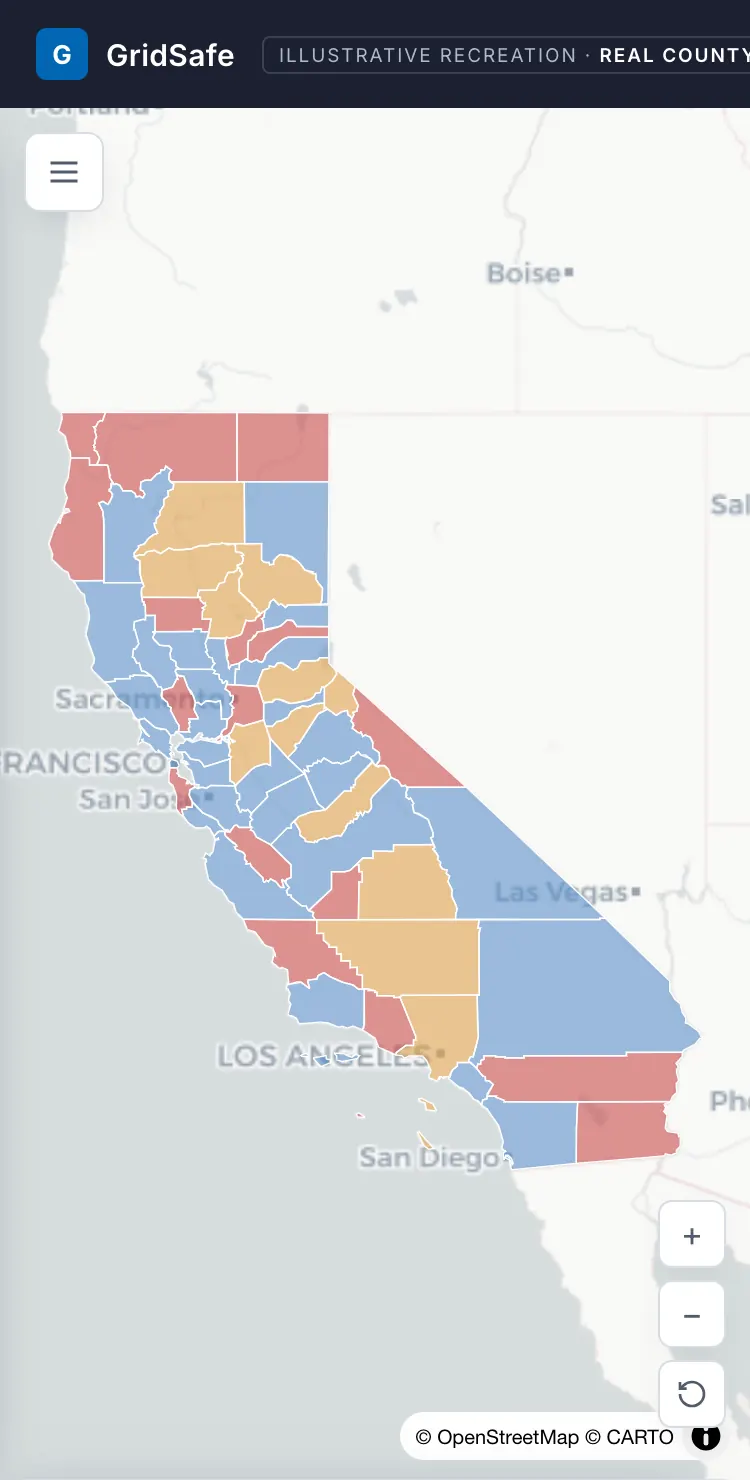
County polygons, service-area outlines, high-fire-threat-district overlays and category-switchable project layers all render from a single D3 data layer over the ESRI base.
Address → county → detail
An address resolves to its county and PSPS-likelihood detail; opening a county pulls up completed mitigation work, circuit status and customer impact in plain language.
Figma to Tailwind, end to end
Every panel, popup, legend and modal was styled in Tailwind directly against the Figma handoff — one design system across the whole surface customers see.
Recreation · faithful to the original UI behavior, not the shipped source.
The problem
A safety tool customers can actually open
Public Safety Power Shutoffs only work as a wildfire-prevention tool if the customers on the receiving end know what's happening, where, and why. The utility had committed publicly to that level of transparency — community-by-community mitigation work, undergrounding plans, sectionalization device installations, the likelihood of a shutoff for any given address — but the existing portal was an aging surface customers had a hard time navigating.
The Community Wildfire Safety Map is the consumer portal that fixed that. A homeowner opens the page, types an address (or picks a county directly), and gets a real answer about their own area before fire season: completed and forecast mitigation work by category, a multi-year PSPS history table, a cities-in-this-county listing, and total mileage of upgrades by type. No phone tree, no PDF download, no “contact your utility representative.”
The PSPS playbook only works if the customers on the other end of it know what's happening, where, and why.
Key decisions
Four choices that defined the build
The map is the visible product, but the lookup flows are how customers actually use it, and the design system is what keeps the whole surface coherent across phone, tablet and desktop. Four decisions did the load-bearing work.
React for the shell, D3 for overlays, ESRI for the basemap
Each rendering layer does the work it's best at. ESRI Maps SDK owns the basemap — tiles, projection, GIS primitives, the underlying geographic accuracy. D3 owns everything on top — county polygons, project markers, hazard zones, category-switchable mitigation overlays — because the work there is data-driven (hundreds of features by category, restyling on interaction, animating between states). React owns the surrounding application surface: the controls (search, filters, dropdown), the modal, the routing.
THE CATCH · Three rendering technologies to coordinate (DOM, SVG-via-D3, ESRI canvas). In exchange, each is doing what it's optimized for, and adding an interactive overlay doesn't fight the basemap's rendering.
A single declarative data layer driving every category
County polygons, service-area outlines, high-fire-threat-district overlays, and every category-switchable project layer all read from one D3 data layer. Switching from undergrounding to hazard prevention to outage-size reduction is a single state change — no re-render of the base, no separate render path per category, no copy-pasted overlay logic that drifts over time.
THE CATCH · More upfront data shaping to fit every category into a unified shape. In exchange, adding a new mitigation category later is one declarative entry, not a new render path.
Address and county both converge on the same detail surface
Two lookup paths — type an address, or click a county directly — converge on one detail modal. PSPS likelihood, cities in the county, completed mitigation work, planned upgrades by category and mileage, all sourced from the same data payload regardless of entry point. Customers don't relearn navigation when they switch from address-based to area-based lookup.
THE CATCH · The modal carries more data and has to load gracefully across both entry points. In exchange, the cognitive load on the customer is roughly one menu, not two.
Figma → Tailwind, no intermediate design layer
Every panel, popup, legend, dropdown and the county modal are styled in Tailwind directly against the Figma handoff. Design tokens (colors, spacing, type) translate 1:1; component variants live in code mapped 1:1 to design system entries. No CSS-modules layer in between, no generic component library to bend toward the design — direct translation, design system as the API.
THE CATCH · Tighter coupling between code and the design source. In exchange, design system changes can't silently drift away from what ships — a Figma update is a code update.
What I built
The map, the lookups, and the county detail
The map layer is React for the application shell with D3 driving every overlay on top of the ESRI Maps SDK basemap. D3 handles county polygons, service-area outlines, high-fire-threat-district overlays, and the category-switchable mitigation markers (undergrounding, hazard prevention, outage-size reduction, enhanced detection) — all rendering off a single declarative data layer so adding a new category later is a data entry, not a new render path.
The two lookup flows — typing an address, or clicking a county directly — are what turn the visualization into a tool. Both converge on the same detail modal: PSPS likelihood, a multi-year shutoff history table, cities in the county, completed and forecast mitigation work by category, total upgrade mileage by type. Customers don't relearn navigation when they switch from address-based to area-based lookup.
The map controls, the category dropdown with its swatch legend, the popup cards on individual project markers, and the full county detail modal all live in the same Figma design system. I held that line in Tailwind so the surface reads consistently end to end, with WCAG 2.1 keyboard and screen-reader support for the broad public audience the map serves.
- React application shell with TypeScript and Tailwind, styled directly against the Figma design system
- D3 overlay layer rendering county polygons, project markers, hazard zones and category-switchable mitigation overlays
- ESRI Maps SDK integration for basemap, projection, and underlying GIS primitives
- Address and county lookup flows; unified detail modal for both entry points
- Full county detail modal: PSPS history, cities, completed mitigation work, planned upgrades by category and mileage
- Search panel, category dropdown, legend, popup cards, zoom and find-my-location controls
- WCAG 2.1 accessibility — keyboard navigation and screen-reader support for the public-information audience the map serves
- Performance work — lazy-loaded category overlays, controlled re-renders, throttled map interactions
Drop me a line.
Email is fastest — I read every one. Glad to hear from teams shipping in regulated, high-traffic, or AI-heavy spots.